One important class of decisions is to decide if a course of action is worthwhile, if the benefits provided will be greater than the cost. The idea of a break-even analysis is to model a system in a way that allows us to determine if what we get from the system will at least pay the costs of running the system. See Break Even Analysis
Sometimes we have a simple yes-or-no cost-benefit analysis decision to make in which nothing will vary, we just need to decide if, giving all the parameters of the situation, the benefits are greater than the costs. More often, we have to make a decision in which some parameters are fixed and known, some parameters are fixed, but can only be guessed at, some parameters can be varied under our control and some parameters can vary but are not under our control:
   input parameters we can vary-----------
                                          |
                                          |
                                      ___\|/_____
                                      |          |
   known, fixed input parameters----->|  SYSTEM  |----->output parameters
                                      |__________|
                                         /|\
                                          |
   parameters we need to estimate---------|
For example, if we are going to manufacture something and sell it, we may know what it would cost us to set up the factory to make the items, and we may have a very accurate estimate of what it will cost us in labor and materials for each item we make. We get to set the price at which we will offer the item for sale, but we can only guess how many items we will actually be able to sell at that price. Before we invest in building the factory, we need to estimate whether we will be able to make money by selling those items, and once we selling, we need to know if we making or losing money by selling the number of items we are selling or if we need to sell more to "break even", i.e. to be making at least as much as we are spending
To take an over-simplified example, suppose we want to make shoes. There are certan fixed costs, F, in setting up the factory. Then there are variable supply costs (e.g. leather, cloth, rubber, etc.) and labor costs (person-hours at some salary and benefit cost per hour) for each shoe we make. These are called "unit costs". Because the number of units (pairs of shoes), x, may vary, the product u*x is call the variable costs. (Some authors prefer to call unit costs variable costs, because they are the basis of the variable costs). Let us use the symbol u for the total unit costs of making each pair of shoes. If we have a sales volume of x pairs of shoes, then our total expenses are
C(x) = F+u*x.
We we get a unit revenue, r, from the sale of each pair of shoes then we will have a total revenue of
R(x) = r*x.
Then we will make a profit of the excess of revenues over costs:
P(x) = R(x) - C(x) = (r - u)*x -F
Therefore, in order to break even, to have neither a loss nor a profit, we sell
xBEP = F/(r - u)
If we sell more than xBEP pairs of shoes, we will have a profit. Once we reach sales at the breakeven point, xBEP, then each additional pair of shoes we sell, will give us a profit of r-u, the difference between the revenue for that pair and the unit costs for that pair. Thus if we want to see a net profit P, we need to sell
x(P) = xBEP + P/(r - u) = (F + P)/(r - u)
Note that we can never break even if r < u, i.e., "you cannot make up for a loss with volume." No matter how many pairs of shoes we sell, we can never become profitable if we price our shoes to make our revenue from selling one pair less than the cost of making that pair.
We rarely can be certain of our actual sales volume in advance. If we assume that our sales will follow a normal distribution, then we will can look up probabilities based on Z-scores (distance from the mean in units of standard deviations) in tables or by using the spreadsheet function NORMSDIST(Z), and we can go from desired cummulative probabilities to Z-scores using the spreadsheet function NORMSINV(P):
| Z | NORMSDIST(Z) | P | NORMSINV(P) | |||
| -6 | 9.86588E-10 | 0.05 | -1.644853627 | |||
| -5.5 | 1.89896E-08 | 0.1 | -1.281551566 | |||
| -5 | 2.86652E-07 | 0.15 | -1.036433389 | |||
| -4.5 | 3.39767E-06 | 0.2 | -0.841621234 | |||
| -4 | 3.16712E-05 | 0.25 | -0.67448975 | |||
| -3.5 | 0.000232629 | 0.3 | -0.524400513 | |||
| -3 | 0.001349898 | 0.35 | -0.385320466 | |||
| -2.5 | 0.006209665 | 0.4 | -0.253347103 | |||
| -2 | 0.022750132 | 0.45 | -0.125661347 | |||
| -1.5 | 0.066807201 | 0.5 | -1.39146E-16 | |||
| -1 | 0.158655254 | 0.55 | 0.125661347 | |||
| -0.5 | 0.308537539 | 0.6 | 0.253347103 | |||
| 0 | 0.5 | 0.65 | 0.385320466 | |||
| 0.5 | 0.691462461 | 0.7 | 0.524400513 | |||
| 1 | 0.841344746 | 0.75 | 0.67448975 | |||
| 1.5 | 0.933192799 | 0.8 | 0.841621234 | |||
| 2 | 0.977249868 | 0.85 | 1.036433389 | |||
| 2.5 | 0.993790335 | 0.9 | 1.281551566 | |||
| 3 | 0.998650102 | 0.95 | 1.644853627 | |||
| 3.5 | 0.999767371 | |||||
| 4 | 0.999968329 | |||||
| 4.5 | 0.999996602 | |||||
| 5 | 0.999999713 | |||||
| 5.5 | 0.999999981 | |||||
| 6 | 0.999999999 | |||||
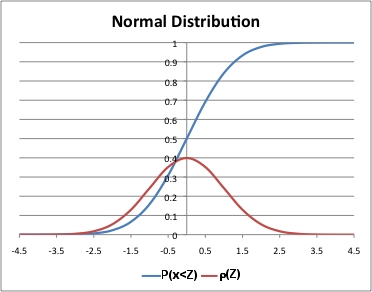
The numbers to the right of any Z-score is the probabiliy of achieving that Z-score or any lower value. If we want the probability of achieving that Z-score or any higher value, we just need to compute 1-NORMSDIST(Z), or, since the normal distribution is symmetric, NORMSDIST(-Z).
Thus if we know the Z-score of selling xBEP or the Z-score of selling x(P) pairs of shoes, we can lookup of the probability of breaking even or of making the desired profit.
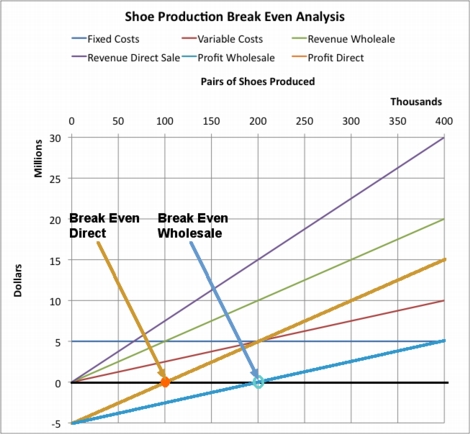
Let us apply this analysis to a specific case. Suppose the factory setup
fixed costs for production of up to 100,000 pairs of shoes per year
is $5,000,000. Suppose the unit materials and labor costs to make
a pair of shoes is $25. Now suppose we try to sell the shoes to retailers
at $50 per pair for them to resell at $100 per pair, for a net profit per
pair of $25. We would need to sell $5,000,000/$25 = 200,000 pairs of
shoes, a full 2 years production to break even before we make any total
profit.
On the other hand, if we market directly to customers and sell at the bargain retail price of $75 per pair, we make $50 per pair and the break even point is at $5,000,000/$50 = 100,000 pairs of shoes, or one year's production. The life of the plant is 10 years. We do a market study and discover that the mean number of pairs of shoes we are likely to be able to sell in 10 years is 750,000 with a standard deviation of 250,000 pairs. Assume we only sell to retailers, not directly to customers. The Z-score of the breakeven point of 200,000 pairs is (200,000-750,000)/250,000 = -2.2. Looking at the Z = -2 entry in the table above, less than 2.3% of the distribution is below the breakeven point and more than 97.7% of the dustribution is above, so sticking to classic retail channels is not a bad bet.
If we sell directly to the public, the Z-score of that breakeven point is (100,000-750,000)/250,000 = -2.6. Look at the Z = -2.5 entry in the table above, less than 0.62% of the distribution is below this breakeven point and nearly 99.4% is above it, a better bet.
Now suppose we want to know the probability of making a profit of at least $5,000,000 so that we will have the money to build the next plant by the time this one is used up. If we sell to retailers, we need to sell 200,000 pairs to make it to the breakeven point and another 200,000 pair to cover the cost of the next plant, the Z-score of x($10,000,000) is (400,000-750,000)/250,000 = -1.4, which lies somewhere between the Z=-1 and the Z=-1.5 entry in the table, i.e. between 6.7% and 16%, and looking at the other side of the table, actually between 6.7% and 10%, so we have a probability of over 90% of making enough profit to build the next plant. If we sell directly to customers, the results are better, needing only 200,000 pairs with a Z-score of -2.2, with a probability of more than 97.7% of reaching our goal.