
Flowcharts, State Transition Tables and State Transition Diagrams
by Herbert J. Bernstein
© Copyright 1999 Herbert J. Bernstein
Flowcharts, state transition tables, and state transition diagrams are important tools in organizing our thoughts and in documenting programs. Flowcharts are graphical representations of flows of information and of flows of control. State transition tables represent the major control decisions of a program in tabular form with the current state of the program on one edge and the possible new inputs or events along the other. State transition diagrams present similar information graphically in the style of a flowchart.
There are many "official" and "unofficial" ways to represent flows graphically.
The most important symbols, naturally, are lines or arrows suggesting the flow itself, so called "flowlines".

If lines are used, rather than arrows, then it is important that the remaining symbols suggest the direction of flow. For example, in diagrams presented in terms of digital logic symbols -- most commonly used for computer circuit diagrams and for programs making complex logical decisions, each symbol for a logical operation has a broader end for its major input connections and a narrower end for its major output connections, so lines without arrows can be used without the risk of confusion. A small circle at the junction of a flow line with a logic symbol indicates negation of the logical state.
|
|
not |
|
|
and |
|
|
or |
|
|
exclusive or |
|
|
nor |
|
|
nand |
When the boxes being connected do not imply the direction of flow, arrows should be used for the flow lines.
When flow lines cross, some way is needed to distinguish between flows that join
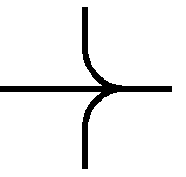
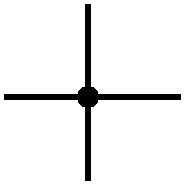
and flows that cross without joining
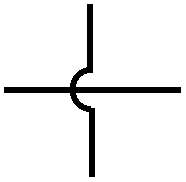
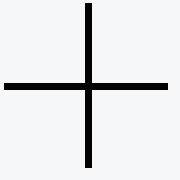
Most data flows and control flows for computer programs are presented on a broader scale than this detailed logic level. In that case symbols suggestive of the media used and operations being performed are used. The formal standard for flowchart symbols used in data processing is ANSI/ISO 5807, "Information processing - Documentation symbols and conventions for data, program and system flowcharts, program network charts and system resources charts",
1985, 25 pp. There are many informal flowchart symbol sets, and it can be very risky to assume that any given flowchart is using a particular set of symbols. It is a good practice to provide a key to any symbols used when writing a flow chart.
When we view an information system in terms of the major physical or logical components within it and draw a chart of the flows of information from component to component, with an indication of the transformations performed, we are creating a "system flowchart". When we draw a chart of the time sequences of events, transformations and decisions to be performed in a software system, we are creating a "program flowchart". While it is common practice to use broad brush stoke top-level flowcharts of both types, it is rarely the case that detailed graphical representations of a software system are created before coding begins. Modern software development environments provide graphical user interfaces which encourage at least some implicit flowcharting, and the complex data flows of distributed applications make simplified flowcharts of data flows in the form of "data flow diagrams" (DFDs) a necessity. However, it may fairly be said that the most important use of flowcharts is in after-the-fact documentation, and that the primary use that a student will have for understanding flowcharts is in reading documentation written by others.
Here is one of many possible sets of symbols for system flowcharts:
|
|
Major subsystem or program |
|
|
Preexisting subsystem |
|
|
Sequential storage |
|
|
Rotating mass storage |
|
|
Printed Document |
|
|
Input, output or manual operation |
|
|
Unit record input or output |
Here is one of many possible sets of symbols for program flowcharts:
|
|
Beginning or end of control flow |
|
|
Process |
|
|
Preexisting process (e.g. from library) |
|
|
Input or output |
|
|
Decision |
|
|
Outgoing connector for flowline |
|
|
Incoming connector for flowline |
|
|
Annotation (comment) |
Another view appropriate to some computational processes is as a "finite state machine", a system which moves from state to state according to the present state and the latest input (or event). In this case, the operation of the system can be presented as a simple state transition table, listing the possible values of the current state as, say, the row labels, and the possible inputs as the column labels. The entries in the table are then the states to which a transition will be made. Alternatively, the possible states may be presented graphically as objects in a graph with flow lines from state to state marked by the relevant inputs or events. The advantage of the tabular presentation is that one need not be concenred with achieving a clear planar presentation. The advantage of the graphical presentation is that only the information relevant to each state transition need be presented with the state.
|
|
Input-1 |
Input-2 |
Input-3 |
Input-4 |
Input-5 |
|
State-1 |
State-1 |
State-3 |
State-1 |
State-4 |
State-1 |
|
State-2 |
State-3 |
State-1 |
State-2 |
State-2 |
State-2 |
|
State-3 |
State-1 |
State-2 |
State-3 |
State-4 |
State-3 |
|
State-4 |
State-2 |
State-4 |
State-4 |
State-4 |
State-1 |
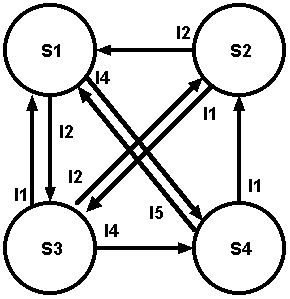
Last Updated on 17 October 1999
By Herbert J. Bernstein
Email: